The purpose of this experiment was to determine protein content of the freeze-dried, desiccated food samples.
Another purpose was to learn and perform the BSA protein determination method.
Another purpose was to learn and perform the BSA protein determination method.

(https://www.thermofisher.com/order/catalog/product/23225)
|

(http://www.systronicsindia.com/Product.aspx?QF1=1&Qf2=UV-Visible%20Spectrophotometers&Qf5=*MFG*)
|
Methods
Sample Preparation:
Sample Preparation:
- Weigh out about 5.0 g of food sample (modified for Kimchi- only used 2.5g)
- Blend 1 part sample with 9 parts distilled water for 1 minute in a homogenizer (for Kimchi, it was a 1:20 dilution).
- Pour 30 ml of homogenate into a 50ml centrifuge tube, labeled with the contents and group number
- Centrifuge samples at 2000 x g for 15 minutes at room temperature
- Collect supernatant
- Filter the supernatant using Whatman filter paper in a funnel (moisten filter paper with extraction buffer)
- Capture the filtered supernatant
- Prepare working reagent by combining Pierce reagent A with Pierce reagent B, 50:1 (v/v)
- Prepare dilutions of the supernatant in distilled water.
- In test tubes, prepare duplicates of each reaction mixture of diluted extracts and BSA solution standards (using 1 mg BSA /ml solution)
- Mix each reaction mixture with a vortex mixer, then incubate in water bath at 37°C for 30 min
- Read absorbance of each tube at 560nm using a spectrophotometer
- Use the data from the BSA samples to create a standard curve of absorbance at 560nm versus μg protein/50 μl. Determine the equation of the line for the standard curve. Calculate the protein concentration (μg/ml) of the extract from each sample using the equation of the line from the BSA standard curve and the absorbance value for a dilution of the sample extract that had an absorbance neat the middle point of the standard curve.
Results
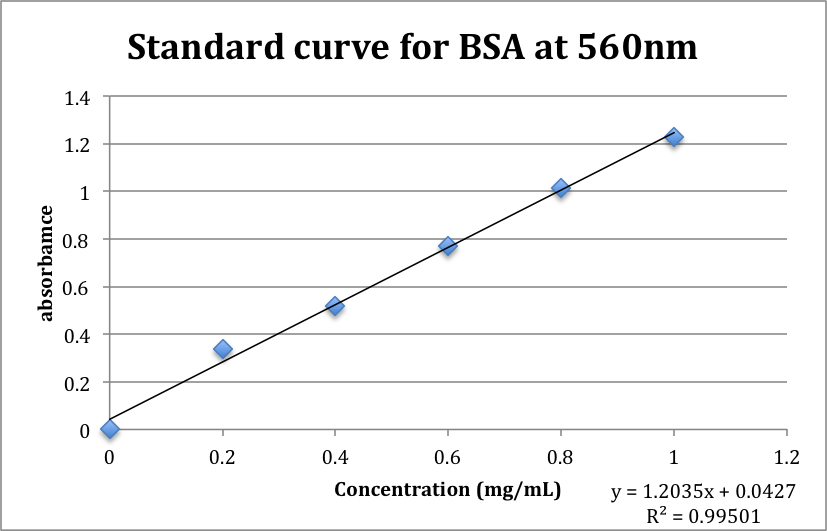
Constructed standard curve using BSA; equation is y = 1.2035x + 0.0427 with a very nice correlation coefficient
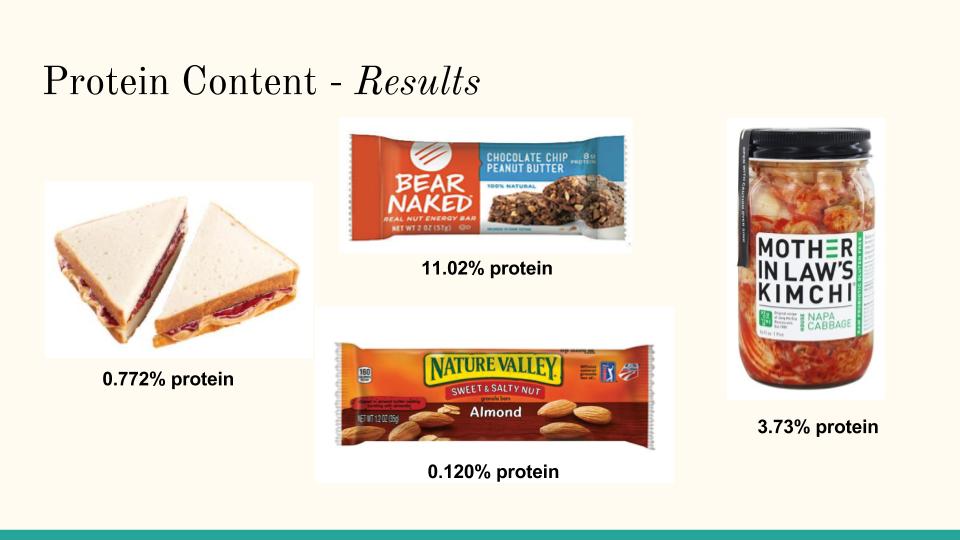
Initially, we was surprised at the amount of protein in the kimchi sample- however, 22.3 mg per mL of dry sample means that there are 2.23 mg per mL in the wet sample (because kimchi is 90% moisture, as initially discovered). This is a more appropriate value for this product, as it is not very dense in any particular nutrient. We were pleased with the outcome of the group’s standard curve, it gave us a really good line to work with and calculate the protein concentrations of each product from our spectrophotometric data. Our sample variance was also very low when doing double readings, so that further assures us that all of our measurements of protein content are valid.
