The purpose of this experiment was to (1) run a sample of milk on an SDS-PAGE and confirm the presence of casein protein
and (2) to learn the procedural technique of running an SDS-PAGE.
and (2) to learn the procedural technique of running an SDS-PAGE.
Methods
Process milk to isolate proteins
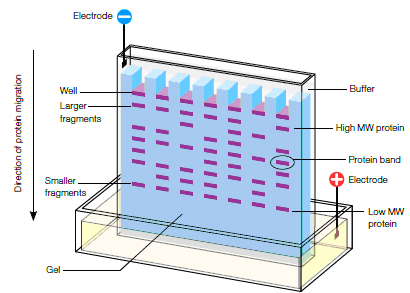
Run gel electrophoresis
Stain and de-stain polyacrylamide gels
Process milk to isolate proteins
- Pipette 40ml of milk into a tube and add 160ml sample buffer (SDS solution)
- Boil for 5 minutes at 95°C
- Dilute samples to desired concentration
- Load 10uL of milk protein dilution into gel well, and 20uL of each standard
Run gel electrophoresis
- Load two Bio-Rad Ready Gels into holder; put holder into center of running tank
- Dilute 10X running buffer with distilled water into 1L of normally concentrated running buffer
- Add running buffer to running tank
- Load protein samples and standards (10uL for samples and 20uL for the Kaleidoscope and unstained ladder standards)
- Affix the lid, to the running tank, taking care that the cathode and anode wires are connected to the right ports (match red to red and black to black)
- Turn on the power supply and set the electrophoresis to run at 100V for 30 minutes
Stain and de-stain polyacrylamide gels
- After successful electrophoresis, carefully remove the gels from their rigid plastic housing by working a measuring spatula into the side seam and slowly prying it open
- It is important to not damage the gels (tearing, gouging) at this step
- Immerse the soft gels in a solution of Coomassie Blue staining solution and allow it to incubate, gently shaking, at room temperature for five minutes
- Drain off the majority of the staining liquid by tilting the container to the side
- Transfer the stained gel to a small pan of de-staining solution (methanol, acetic acid, and distilled water); shake gently to allow de-stainer to circulate around the gel
- Repeat the previous step once more
- Be sure not to de-stain the gel too much, otherwise you won't see any protein bands at all
- Drain off excess liquid and lay polyacrylamide gel on a light-board to evaluate the results of electrophoresis
Results
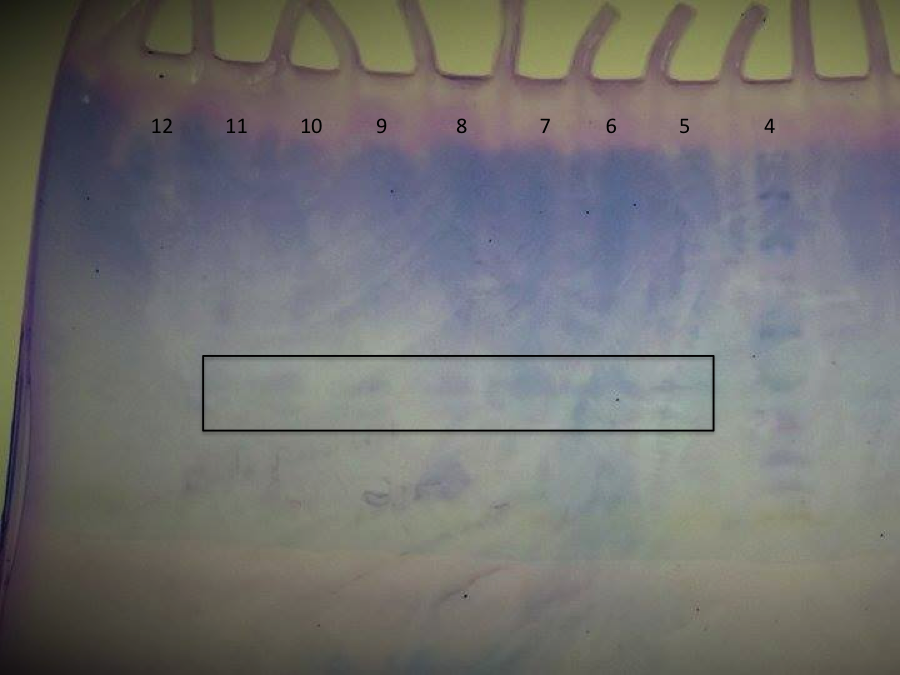
The resultant gel electrophoresis of our milk samples- note that the gel got flipped around during de-staining, so the wells go from right to left.
As shown in the picture above, there is a clearly defined band in wells 5-11 that gets less intense from right to left as the concentration of protein decreases. The kaleidoscope band that is closest to the milk proteins is green, which is BSA or bovine serum albumin with an approximate molecular weight of 78 kDa (source: Bio-Rad). However, since the milk protein bands travel further in the gel than the green kaleidoscope marker, it can be said that the weight could be closer to the violet marker, corresponding to 45.7 kDa. This density value is still not light enough to conclusively be any milk protein, but errors in our use of the electrophoresis apparatus could have affected the distance traveled by both the proteins and the standards. The takeaway is, though, that the intensity of the bands are directly correlated with the concentration of milk proteins added, and that there aren’t any errant proteins in the mix. Though the densities don't match up, we suspect the band from milk to be casein. We would have liked to try this experiment with a few different milk samples, as well as samples of whey or something different like soy protein isolates. This was a good introduction to the concept of using electrophoresis in a food analysis environment, and also a good lesson in the delicacy of the procedure.
